Power BI Analytics Project
Spotify Re-Wrapped
Analysed over 158,000 Spotify listening events to compare artist rankings by play count versus listening hours and build a more meaningful version of Spotify Wrapped.
Why I Built This
As everyone does in December, I received my Spotify Wrapped and I was not content! I felt that Spotify Wrapped did not fully reflect my actual listening habits. It ranks artists and tracks heavily around play counts but I feel that a play does not always best represent my habits.
I wanted to investigate whether listening time provided a better measure of music preference than simple stream count. This project became my own version of Spotify Wrapped, using my complete Spotify history instead of a single yearly snapshot.
Dataset
The dataset was built from Spotify's Extended Streaming History export and contained listening activity from 2018 to 2026.
158,376
Listening events
5,157
Listening hours
11,074
Unique tracks
Methodology
Import JSON Files
I imported multiple Spotify JSON files into Power BI using Power Query and combined them into one clean listening history table.
Clean & Transform Data
I removed unnecessary metadata, cleaned incomplete records, converted timestamps and created new columns for year, month, day and hour analysis.
Build DAX Measures
I created DAX measures for total listening hours, play counts, unique artists, unique tracks and ranking changes between Spotify-style play counts and listening-hour rankings.
Compare Ranking Methods
The dashboard compares artists by number of plays and by total listening hours to show how different metrics can change the final ranking.
Dashboard Visualisation
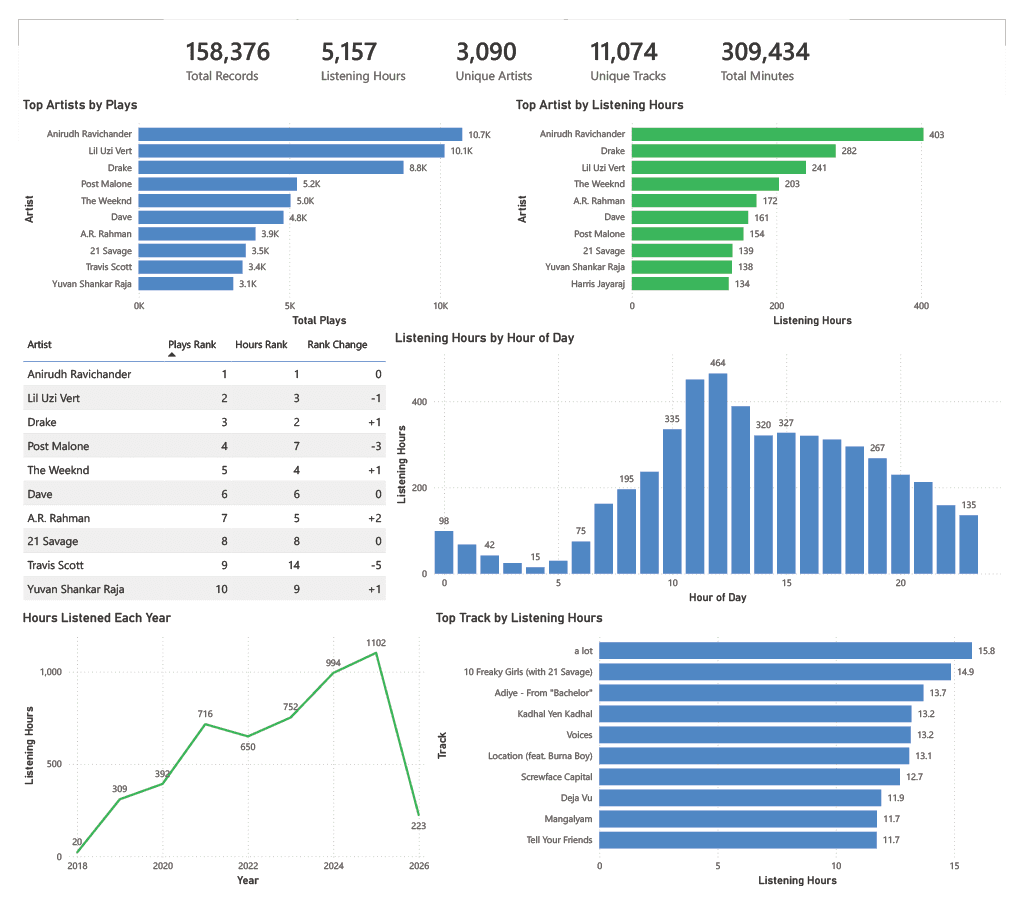
The final Power BI dashboard compares Spotify-style rankings against listening-hour rankings. Hover over the markers to explore the key insights.
Top Artists by Plays
Ranks artists using Spotify's traditional play count metric across my complete listening history from 2018–2026.
Top Artists by Hours
Ranks artists by total listening hours rather than play count. This provides a more representative measure of long-term listening preference.
Listening Behaviour
Compares artist rankings using both play count and listening hours, highlighting how rankings change when a different engagement metric is used.
Listening Over The Day
This chart shows how my listening activity is distributed throughout the day. Most listening occurred around midday, suggesting music was commonly played during my lunch.
Hours Each Year
Tracks total listening hours by year. Listening increased steadily over time before reaching a peak of 1,102 hours in 2025!
Top Tracks
This chart ranks my all-time favourite tracks by listening hours, complementing the artist-level analysis.
Power BI dashboard analysing my Spotify listening history from 2018 to 2026.
Key Findings
Listening Hours Changed the Rankings
Some artists moved up or down when ranked by listening time, showing that play count alone does not fully capture engagement.
Listening Peaked in 2025
Total listening hours increased over time and reached their highest point in 2025.
Daytime Listening Dominated
Most listening occurred during the middle of the day, with noticeably less activity late at night.
Artist and Track Rankings Differed
Artist rankings reflected long-term preferences, while track rankings highlighted individual songs that I listened to frequently.
What I Learned
This project improved my understanding of Power Query, DAX and Power BI dashboard design.
It reinforced the importance of metric selection. The same dataset can produce different conclusions depending on whether engagement is measured by play count or listening duration. I was more content with the new rankings and as I feel they reflect my music preference better.
Future Improvements
Future improvements would include enriching the dataset with Spotify API metadata such as track duration, genre, release year and popularity score.
This would allow deeper analysis such as track completion rate, genre trends over time and a more advanced weighted scoring model for an even detailed personalised Spotify Wrapped.